

Old Hampshire Mapped
Distance Table
Norden's Hampshire, 1607Measurements are made in pixels from the .tif archive image of the map. Note that the calculated distances are independent of translation, rotation and scaling of the image.
|
|
Old Hampshire Mapped |
|
|
Distance TableNorden's Hampshire, 1607 |
|
The distance table is derived from measurements of positions
of towns on the map, using DISTTAB.exe software. Measurements are made in pixels from the .tif archive image of the map. Note that the calculated distances are independent of translation, rotation and scaling of the image. |
|
| ALT |
AND |
BSK |
BWM |
CHR |
FRH |
FDB |
GOS |
HVN |
KCL |
LMG |
ALR |
ODH |
PTF |
POR |
RGW |
ROM |
SOT |
STB |
WHC |
WIN |
||
| Alton (ALT) | 0.0 | ALT | ||||||||||||||||||||
| Andover (AND) | 21.7 | 0.0 | AND | |||||||||||||||||||
| Basingstoke (BSK) | 7.8 | 17.9 | 0.0 | BSK | ||||||||||||||||||
| Bishops Waltham (BWM) | 18.5 | 19.3 | 22.3 | 0.0 | BWM | |||||||||||||||||
| Christchurch (CHR) | 48.7 | 37.0 | 50.3 | 30.6 | 0.0 | CHR | ||||||||||||||||
| Fareham (FRH) | 23.7 | 26.6 | 28.7 | 7.5 | 29.1 | 0.0 | FRH | |||||||||||||||
| Fordingbridge (FDB) | 39.0 | 23.7 | 38.9 | 23.3 | 14.1 | 25.4 | 0.0 | FDB | ||||||||||||||
| Gosport (GOS) | 28.5 | 32.1 | 34.1 | 13.1 | 28.8 | 5.7 | 27.9 | 0.0 | GOS | |||||||||||||
| Havant (HVN) | 22.7 | 31.5 | 29.3 | 12.6 | 36.0 | 7.6 | 33.0 | 7.9 | 0.0 | HVN | ||||||||||||
| Kingsclere (KCL) | 15.1 | 13.4 | 7.7 | 24.7 | 49.3 | 32.0 | 36.7 | 37.6 | 34.1 | 0.0 | KCL | |||||||||||
| Lymington (LMG) | 38.9 | 30.6 | 41.4 | 20.4 | 10.8 | 18.4 | 13.1 | 18.3 | 25.3 | 41.5 | 0.0 | LMG | ||||||||||
| New Alresford (ALR) | 9.6 | 15.5 | 12.5 | 9.8 | 39.1 | 16.4 | 29.4 | 21.9 | 18.3 | 15.9 | 29.5 | 0.0 | ALR | |||||||||
| Odiham (ODH) | 6.3 | 23.0 | 5.3 | 24.2 | 53.6 | 29.8 | 43.0 | 34.8 | 29.0 | 12.7 | 44.2 | 14.7 | 0.0 | ODH | ||||||||
| Petersfield (PTF) | 10.5 | 24.9 | 17.5 | 12.1 | 42.4 | 14.7 | 35.3 | 18.7 | 12.3 | 23.4 | 32.0 | 9.3 | 16.7 | 0.0 | PTF | |||||||
| Portsmouth (POR) | 27.6 | 32.4 | 33.4 | 13.2 | 30.4 | 5.8 | 29.2 | 1.6 | 6.4 | 37.3 | 19.9 | 21.4 | 33.9 | 17.7 | 0.0 | POR | ||||||
| Ringwood (RGW) | 42.8 | 29.6 | 43.7 | 25.7 | 7.7 | 25.9 | 6.4 | 27.1 | 33.4 | 42.1 | 9.5 | 33.2 | 47.4 | 37.8 | 28.6 | 0.0 | RGW | |||||
| Romsey (ROM) | 25.8 | 14.7 | 26.4 | 11.0 | 23.9 | 15.7 | 13.3 | 20.2 | 22.7 | 25.5 | 16.2 | 16.2 | 30.1 | 22.4 | 21.0 | 17.3 | 0.0 | ROM | ||||
| Southampton (SOT) | 27.9 | 22.4 | 30.6 | 9.5 | 21.2 | 9.6 | 15.8 | 12.7 | 17.2 | 31.5 | 11.0 | 18.6 | 33.2 | 21.3 | 13.8 | 16.8 | 8.4 | 0.0 | SOT | |||
| Stockbridge (STB) | 23.1 | 6.7 | 21.4 | 14.8 | 30.7 | 21.5 | 17.9 | 26.7 | 27.4 | 18.8 | 24.0 | 14.6 | 26.0 | 23.2 | 27.2 | 23.4 | 8.0 | 16.1 | 0.0 | STB | ||
| Whitchurch (WHC) | 16.6 | 6.9 | 11.4 | 20.2 | 42.7 | 27.7 | 30.0 | 33.4 | 31.1 | 6.7 | 35.4 | 13.2 | 16.7 | 22.2 | 33.3 | 35.5 | 19.2 | 25.9 | 12.1 | 0.0 | WHC | |
| Winchester (WIN) | 18.4 | 11.3 | 19.1 | 8.1 | 31.2 | 15.2 | 20.6 | 20.8 | 20.5 | 19.1 | 22.5 | 8.9 | 22.6 | 16.5 | 21.0 | 24.8 | 7.5 | 12.4 | 7.0 | 13.5 | 0.0 | WIN |
|
Figures on the diagonal are from
a place to itself, thus zero. |
|
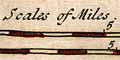
Map MilesNorden's Hampshire, 1607The measured average scale is 5.93 statute miles to 1 inch. ie 1 to 375770 The range of scales is from 3.83 to 7.72 statute miles to 1 inch. The map scale is about:- 1 to 380000 6 statute miles to 1 inch From its scale line (1), the map scale is 4.78 map miles to 1 inch. Map miles = 1.24 statute miles. |
|||
|
Calculated ScalesNorden's Hampshire, 1607scales frequency diagram |
|
| 3.0 | * | |
| 3.5 | * | |
| 4.0 | ************** | |
| 4.5 | ******************************************************************************* | |
| 5.0 | ******************************************************************************** | |
| 5.5 | ************************ | |
| 6.0 | ******* | |
| 6.5 | **** | |
| Average scale = 5.93, | ||
| rms deviation = 0.49 ie 8% | ||
|
product moment correlation coefficient: map and known
distances = 0.992 product moment correlation coefficient: map and known positions (Eings and Nings) = 0.991 beware of the 'meaning' of these figures! |
|
DISTANCE TABLESDISTTAB.exeMN: 28.8.2002 version 2.24 |
|
|
 |
General index |
|
|
Old Hampshire Mapped, contents |